Mini service analytics
This topic shows you a summary of the metrics of mini service and how the metrics are calculated.
Overview
The mini service analytics provides traffic data for mini service from different perspectives, such as clicks, page views, unique visitors, and so on. These data visualize the performance of mini service which helps native app providers learn users' needs, make predictions, and develop business plans.
Benefits
You can benefit from mini service analytics in the following aspects:
- Unique to you—Identify popular pages in mini service and locate welcome mini programs.
- Download data—Download data in Excel format to further analyze mini service performance.
- Automate—Fetch the data you need by selecting your section and specific date or date range.
Key features
To analyze the mini service traffic performance, navigate to Operation > Mini Service > Mini Service Analytics. Here the data is displayed by section, visit, and function. You can track data by selecting Date or Date Range. For example:
- Select Daily and 2021-08-30 to check data on August 29th, 2021.
- Select Last 7 Days and 2021-8-30 to check the last 7 days' data from August 29th, 2021.
- Select Last 30 Days and 2021-8-30 to check the last 30 days' data from August 29th, 2021.
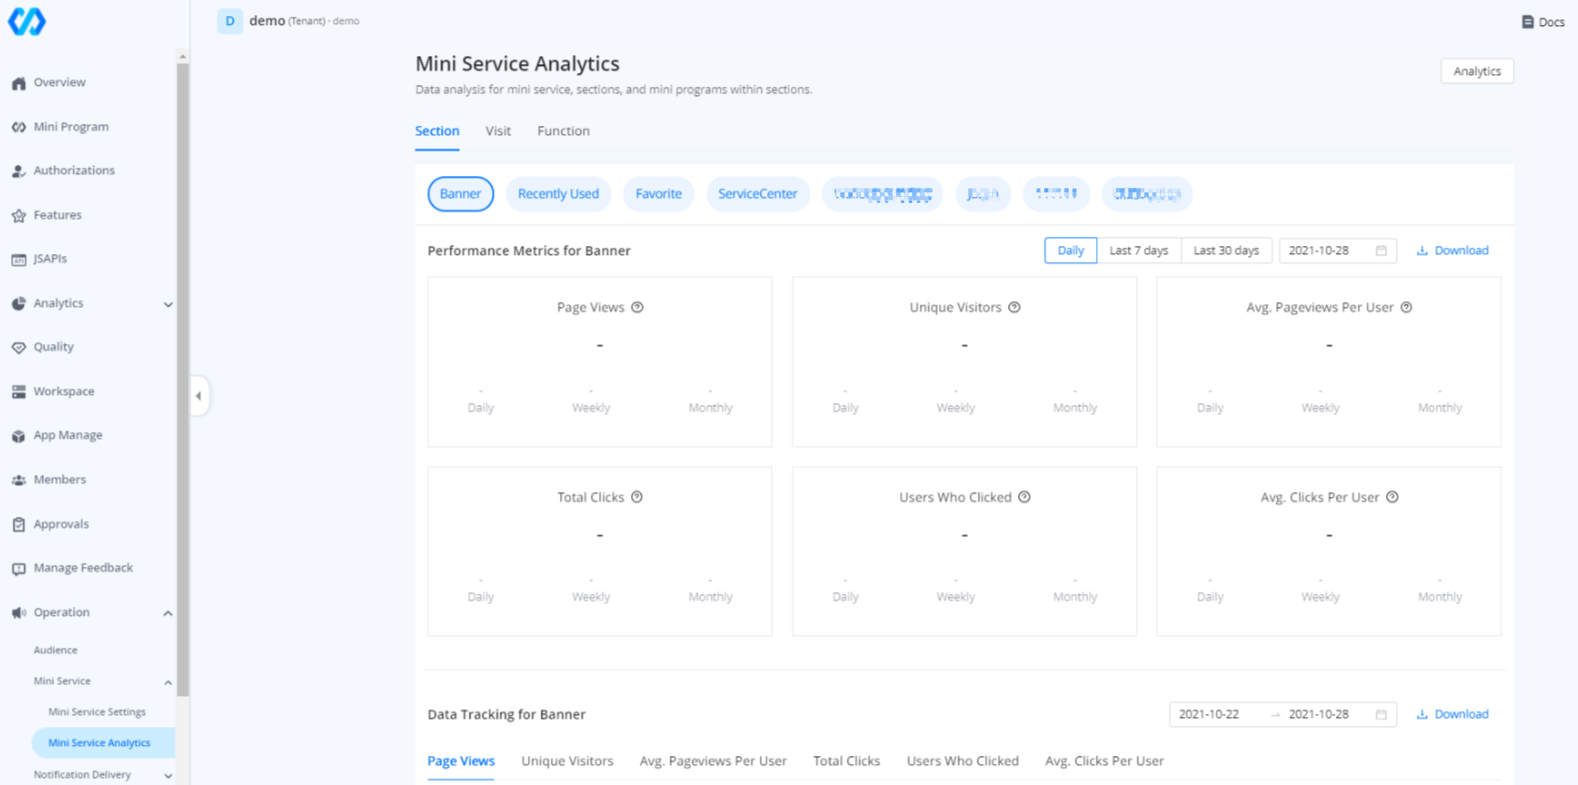
Section
Use Section to get a performance overview of all sections in the mini service.
Performance Metrics
Performance Metrics are a collection of data that you evaluate against a section. You can track users' behaviors and measure the achievement of overall goals. These data help you find out what kind of mini programs attract the most users.
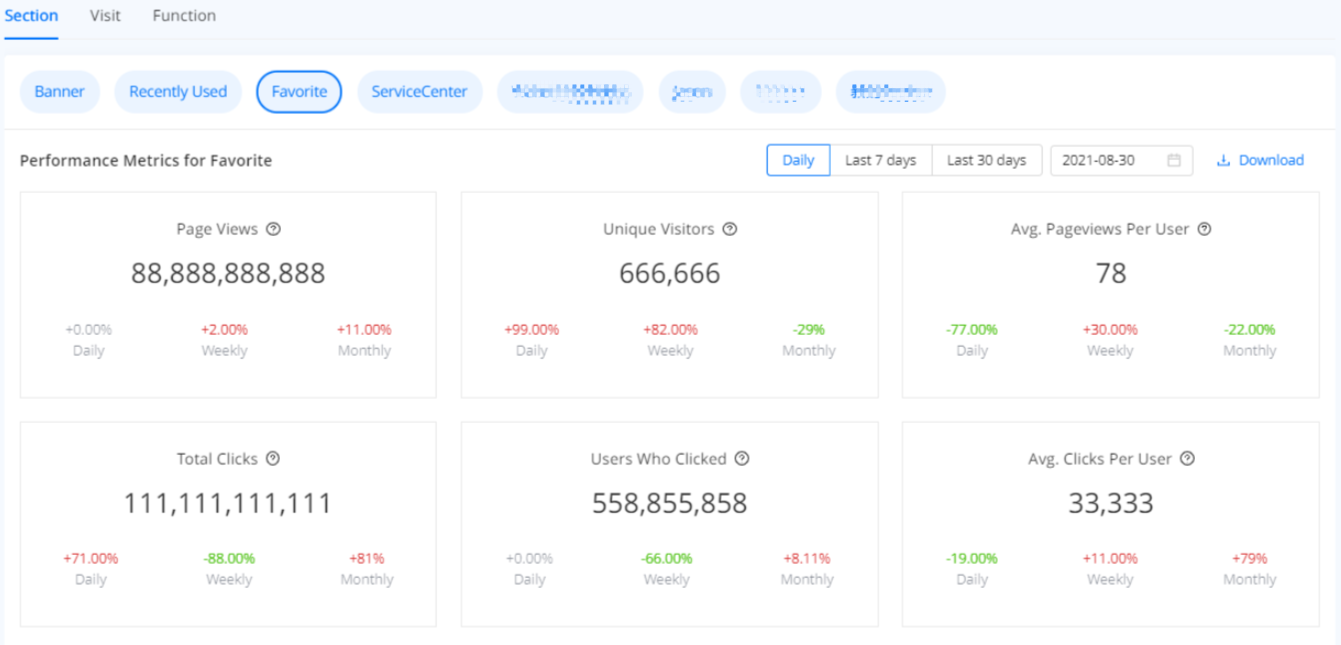
6 metric cards are displayed, where you can see the corresponding data and percentage changes on a daily, weekly, and monthly basis:
Metric | Description |
Page Views | The total number of page views of a section. |
Unique Visitors | The total number of users who visit a section. A user who visits a section multiple times is still considered to be a single unique visitor. |
Avg. Pageviews Per User | The average number of page views for each unique visitor of a section. This metric is calculated by dividing unique Visitors into page views. |
Total Clicks | The total number of clicks in a section. |
Users Who Clicked | The total number of users who clicked in a section. |
Avg. Clicks Per User | The average number of clicks for each user who visited the section. This metric is calculated by dividing users who clicked into total clicks. |
Data Tracking
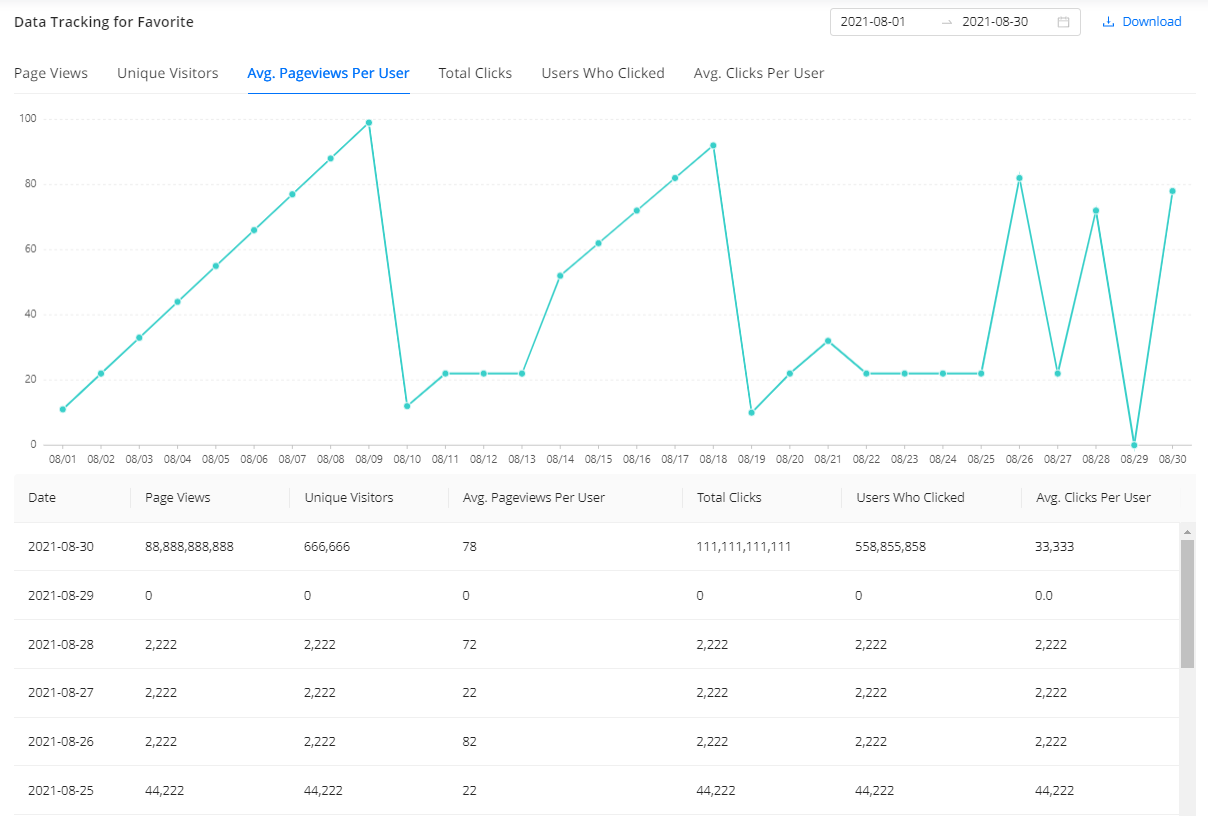
Data Tracking presents the same metrics as Performance Metrics via a line graph and a table. You can see how data change continuously within the selected date range.
Visit
Use Visit to discover the most popular mini programs and pages in mini service.
Mini Program
Mini Program helps you monitor mini program traffic in different sections. Users' behavior, such as coming through to your sections and browsing or using your mini programs, will be reflected via data here.

Under Mini Program, you can see the top 5 mini programs in the mini service, ranked in order of unique visitors and page view, within a selected day or date range. Currently, the following metrics are available:
Metric | Description |
Top 5 Unique Visitors | The number of users who visit a mini program and the percentage of a mini program's unique visitors to the total. |
Top 5 Page Views | The number of page views of a mini program and the percentage of a mini program's page views to the total. |
Page
Page visualizes the path users traveled through in mini service. Here you can discover what content keeps users engaged with mini service or identify potential content issues.

Under Page, you can see the top 5 pages in the mini service, ranked in the order of unique visitors and page views, within a selected day or date range. Currently, the following metrics are available:
Metric | Description |
Top 5 Unique Visitors | The number of users who visit a page and the percentage of a page's unique visitors to the total. |
Top 5 Page Views | The number of page views of a page and the percentage of a page's page views to the total. |
Function
Use Function to check how users interact with Favorites and Mini Service Research.
Overall Metrics of Favorites
Overall Metrics only shows data from Favorites, which is a folder for users' commonly used items. You can measure the overall number of loyal users who use mini programs in the super app and how many mini programs users engage the most.

2 metric cards are displayed, where you can see the relevant data and percentage changes on a daily, weekly, and monthly basis:
Metric | Description |
Accumulated Mini Program (Favorited) | The number of mini programs added to Favorites until now. Mini programs that are added to Favorites but removed later are not counted in this metric. |
Accumulated Users (Favorited) | The number of users who added mini programs to Favorites until now. |
You cannot select a date or date range here because they are the accumulated data from the creation time of Favorites until now.
Favorites
In addition to the accumulated data, you can also learn about how often users use the Favorites folder and which mini programs users want to explore one more time.
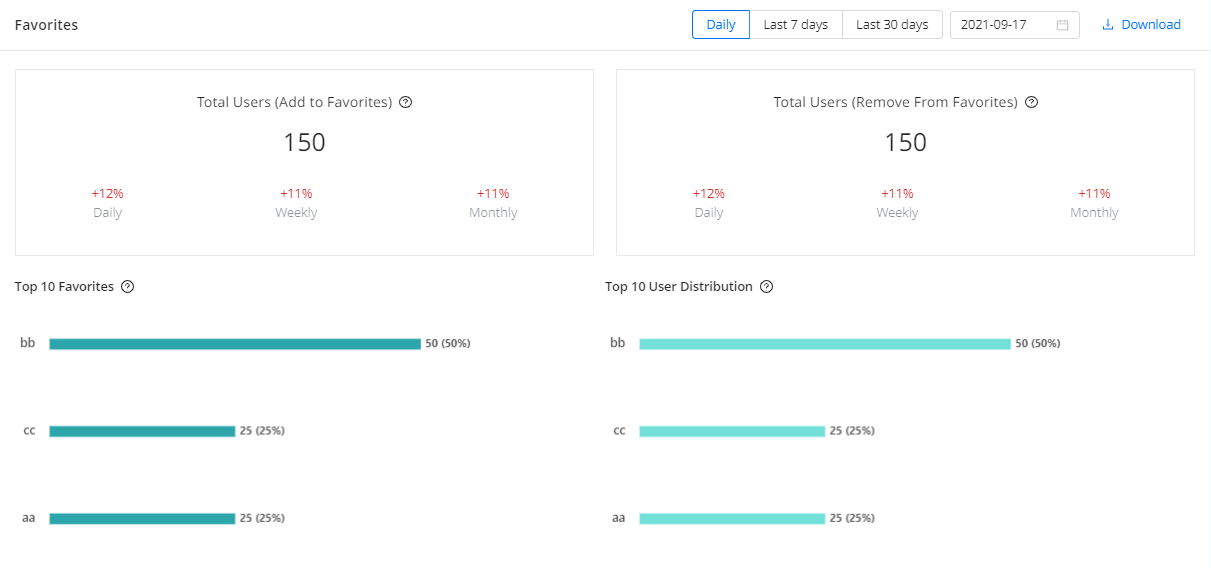
2 metric cards are displayed, where you can see the relevant data and percentage changes on a daily, weekly, and monthly basis. There are also two ranks that show you mini programs with high retention rates.
Metric | Description |
Total Users (Add to Favorites) | The number of users who added mini programs to Favorites. |
Total Users (Remove from Favorites) | The number of users who removed mini programs from Favorites. |
Top 10 Favorites | The number of times a mini program is added to Favorites and what percentage of the times a mini program is added to Favorites to the total. |
Top 10 User Distribution | The number and percentage of users by different number ranges of favorite mini programs. Here, 1-3 MP means 1 to 3 mini programs are added to Favorites. |
Mini Service Search
Mini Service Search helps you understand how active users explore in mini service and what kind of content they care about most. For example, which keywords they entered and how effectively the search results created deeper engagement with mini service.
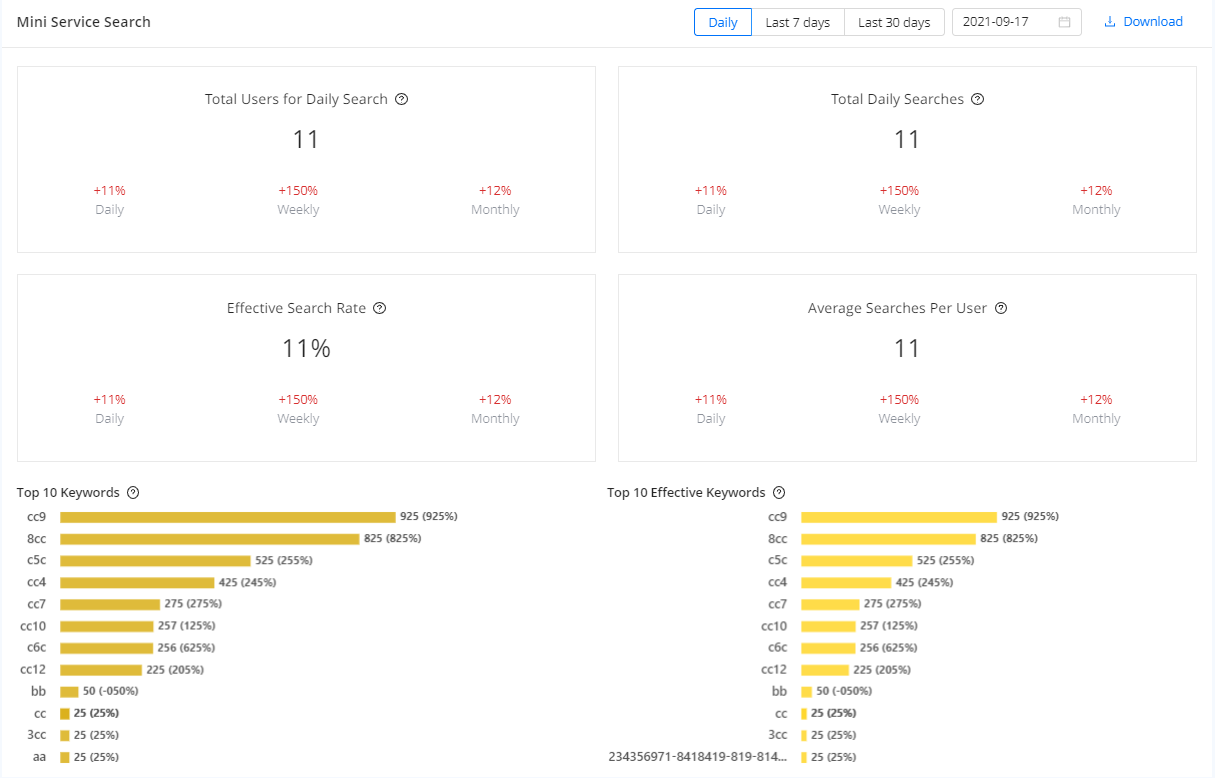
4 metric cards are displayed, where you can see the relevant data and percentage changes on a daily, weekly, and monthly basis. There are also 2 ranks that show you the popular search items.
Metric | Description |
Total Users for Daily Search | The number of users who performed the mini service search function per day. |
Total Daily Searches | The number of searches per day. |
Effective Search Rate | The percentage of searches with results to total searches. |
Average Searches Per User | The average number of searches per user. |
Top 10 Keywords | The number of times a keyword is searched and the percentage of the times a keyword is searched to the total. |
Top 10 Effective Keywords | Effective keywords refer to search terms that return results in mini service. You can see the number of times an effective keyword is searched and the percentage of the times an effective keyword is searched to the total. |